Northeast
Oldest housing; expect no-neutral switch boxes, plaster walls and radiator heat. Broadband is highest at 74.7%, home audio lowest at 21.6%. Budget electrician time per box and use basements for wired runs.
Loading...
Home Control Notes · Locations
Smart home adoption is broadly national, but climate, housing age and construction change the plan. The EIA's 2024 survey shows home audio ownership highest in the West and broadband highest in the Northeast, while older Northeast housing raises the odds of switch boxes without neutral wires. This page summarizes those differences and matches you with installers in your area.
The EIA's 2024 Residential Energy Consumption Survey is the only public source that breaks smart home ownership out by census region with a stated denominator, and our analysis of its household microdata says adoption is more uniform than marketing suggests. Smart-speaker lighting control, 10.3% of homes nationally, sits between 10.1% and 10.7% in every region. What differs is the house around the devices: wiring era, basements, attics, heat and freeze exposure.
This page keeps the regional figures exactly as the survey states them, occupied primary residences by census region, and does not extrapolate to states or cities. Use it to anticipate what a local installer will find, then request estimates through the contact page; matching is by service area.
Oldest housing; expect no-neutral switch boxes, plaster walls and radiator heat. Broadband is highest at 74.7%, home audio lowest at 21.6%. Budget electrician time per box and use basements for wired runs.
Slab foundations route cabling through hot attics; keep equipment in conditioned space. Weather-rated exterior gear and surge protection matter. Highest speaker-based security control at 9.7% of homes.
Basements simplify wiring and house racks well. Freeze exposure makes leak sensors and a shutoff valve high value. Broadband lowest at 71.6%; home audio 26.7%.
Highest home audio ownership at 28.7% and most outdoor zones. Plan battery backup for network, hub and locks where power shutoffs occur, and specify heat-rated exterior devices.
Nationally the EIA found broadband in 73.2% of occupied primary residences, a smart speaker in 35.6%, and a home theater or audio system in 25.0%. Regionally, broadband runs from 71.6% in the Midwest to 74.7% in the Northeast. Audio-system ownership ranges from 21.6% in the Northeast to 28.7% in the West, with the Midwest at 26.7% and the South at 23.5%.
Voice control of security devices, 9.0% nationally, ranges from 7.5% of homes in the Northeast to 9.7% in the South, and temperature control, 6.2% nationally, from 5.4% in the Northeast to 6.8% in the Midwest and West. Streaming devices, in 66.5% of homes, run from 63.2% in the Northeast to 67.8% in the South, and multi-speaker homes, 18.5% nationally, vary by under a point. These are small spreads. The practical reading is that an installer in any region has seen the same devices; what changes is the building they go into.
| Region | Broadband | Home audio system | Speaker controls lights | Speaker controls security |
|---|---|---|---|---|
| Northeast | 74.7% | 21.6% | 10.1% | 7.5% |
| Midwest | 71.6% | 26.7% | 10.5% | 9.1% |
| South | 72.9% | 23.5% | 10.1% | 9.7% |
| West | 74.0% | 28.7% | 10.7% | 8.9% |
The Northeast has the country's oldest housing stock, which means more switch boxes without neutral wires, plaster-and-lath walls that resist fishing cable, and radiators rather than forced air, so thermostat automation may involve zone valves rather than a single smart thermostat. Budget for an electrician's time per box on lighting projects and for surface raceway or conduit where walls cannot be opened. Basements are common and make wired camera and speaker runs easier than in slab-on-grade regions.

Slab foundations and single-story layouts push cabling into attics, where summer temperatures shorten the life of equipment left there; keep hubs, recorders and amplifiers in conditioned space. Humidity and storms argue for weather-rated exterior devices and surge protection on the network and doorbell transformer. The South's cooling loads make an ENERGY STAR smart thermostat's 8% / $50 saving worth more in dollars, and the region reports the highest smart-speaker security control at 9.7% of homes.
Basements make wired runs straightforward and give a rack or recorder a cool home, though moisture and radon deserve a check before finishing a media room. Freeze exposure raises the value of water leak sensors and a shutoff valve; LexisNexis found claims fell 96% after installation. Detached garages are common, and Parks Associates counts a smart garage opener in 11% of internet households; a wired network drop to the garage beats a Wi-Fi bridge that fails at the property edge.
The West leads in home audio at 28.7% of homes and in outdoor zones, which need heat- and sun-rated speakers and cameras. Wildfire and public safety power shutoffs in parts of the region make battery backup for the router, hub and locks a practical requirement rather than an option, and they make offline behavior the first question in any whole-home plan. Newer stock in much of the region means neutral wires and open framing are more common than in the Northeast.
Requests are routed to independent installers who serve your area and handle your scope. Matching does not rank installers or claim any of them is the best available; it introduces you, and the written estimate does the rest. Because adoption is national, the useful local questions are about the house: wiring era, wall type, attic or basement access, outage frequency and any local permit rules for alarms or exterior cameras. The reviews page explains how to check a local installer's track record yourself.
Homes with at least one smart speaker: 37% nationally. Highest in Utah (46.2%), Iowa (45%), Massachusetts (44%); lowest in Vermont (25.6%), Arkansas (26.1%), New Mexico (26.4%).
Homes with a backup generator: 20.3% nationally. Highest in Maine (53.7%), Louisiana (39.9%), New Hampshire (36.1%); lowest in Colorado (9.6%), District of Columbia (9.9%), Arizona (10.9%).
Households with an electric vehicle: 4.5% nationally. Highest in California (12.5%), Hawaii (9.3%), Colorado (8.9%); lowest in Tennessee (3.1%), Texas (3.3%), Illinois (3.4%).
Home Control Notes calculated these state estimates from the Energy Information Administration's 2024 household survey microdata. EIA publishes the 2024 survey nationally and by region, not by state. Shares are weighted; a dash means the state sample was too small for a reliable estimate (fewer than 100 households, fewer than 10 yes answers, or a relative standard error above 30%). Source data.
| State | Homes with at least one smart speaker | Homes with a backup generator | Households with an electric vehicle |
|---|---|---|---|
| United States | 37% | 20.3% | 4.5% |
| Alabama | 31.3% | 24.1% | — |
| Alaska | 32.2% | 31.8% | — |
| Arizona | 37% | 10.9% | 5.1% |
| Arkansas | 26.1% | 21.5% | — |
| California | 37.8% | 11.1% | 12.5% |
| Colorado | 43.2% | 9.6% | 8.9% |
| Connecticut | 37.7% | 33% | 4.7% |
| Delaware | 41.5% | 24.4% | 7.5% |
| District of Columbia | 31.5% | 9.9% | 5.2% |
| Florida | 41.9% | 30% | 5% |
| Georgia | 35.9% | 21% | — |
| Hawaii | 30% | 17.9% | 9.3% |
| Idaho | 30.8% | 20% | — |
| Illinois | 41.7% | 16.6% | 3.4% |
| Indiana | 30.4% | 16.5% | 3.5% |
| Iowa | 45% | 22.7% | — |
| Kansas | 35.5% | 13.3% | — |
| Kentucky | 38.3% | 22.6% | — |
| Louisiana | 27.7% | 39.9% | — |
| Maine | 28.3% | 53.7% | — |
| Maryland | 41% | 19.9% | 8% |
| Massachusetts | 44% | 17.7% | 6.3% |
| Michigan | 35.7% | 34.2% | — |
| Minnesota | 34.3% | 19.3% | — |
| Mississippi | 27% | 28.8% | — |
| Missouri | 30.5% | 18.4% | — |
| Montana | 30.8% | 19.1% | — |
| Nebraska | 43.7% | 15.2% | — |
| Nevada | 36.8% | 11.3% | 4.7% |
| New Hampshire | 36.2% | 36.1% | — |
| New Jersey | 41.1% | 19.4% | 5.2% |
| New Mexico | 26.4% | 11.2% | — |
| New York | 38.9% | 17.3% | 3.7% |
| North Carolina | 34.9% | 25.9% | — |
| North Dakota | 34.4% | 20.7% | — |
| Ohio | 34.7% | 20.1% | — |
| Oklahoma | 30% | 26.8% | — |
| Oregon | 27.9% | 18.8% | 7.7% |
| Pennsylvania | 36% | 20.8% | — |
| Rhode Island | 33% | 28.2% | — |
| South Carolina | 43.4% | 25% | — |
| South Dakota | 31.2% | 22.8% | — |
| Tennessee | 34.8% | 19% | 3.1% |
| Texas | 37.6% | 19.3% | 3.3% |
| Utah | 46.2% | 16.3% | — |
| Vermont | 25.6% | 19.5% | 7.1% |
| Virginia | 32.6% | 19.9% | 4.4% |
| Washington | 42.6% | 19.5% | 8.6% |
| West Virginia | 29.4% | 31.8% | — |
| Wisconsin | 36.7% | 15.2% | — |
| Wyoming | 29.4% | 25.3% | — |
Homeowner polls
No votes yet. Yours will be the first. · saved on this device
Parks Associates puts the average U.S. internet household at about 17.
No votes yet. Yours will be the first. · saved on this device
Because smart home devices are sold nationally through the same retailers and platforms, and the EIA's survey measures ownership rather than spending. Speaker-based lighting control sits within a single percentage point across all four regions. Differences that matter to a project come from the house, not the market: wiring era, wall construction, foundation type and climate exposure. Plan around those.
Not from this source. The EIA publishes census-region figures with stated standard errors, and this site does not extrapolate them to states or cities because the survey was not designed for that. For local context, ask installers what they see in your housing stock, and check your utility's smart thermostat rebate program, which often publishes participation figures.
They specify exterior devices rated for the temperatures a porch actually sees, keep hubs and batteries indoors, and lean on leak detection and shutoff valves. They also tend to run wired cameras and speakers through basements. Thermostat automation may involve boilers and zone valves rather than a single forced-air thermostat, which changes the equipment and the electrician's role.
Alarm permits and false-alarm fines, audio-recording notice laws for cameras, homeowners association rules on exterior devices, and electrical permit requirements for new circuits. Some jurisdictions license low-voltage work separately. A local installer should know these; ask them to list which permits apply to your scope and who files them.
Yes. Areas with frequent outages or planned power shutoffs should treat battery backup for the router, hub, locks and recorder as core scope, and should favor devices that process automations locally. Ask the installer to demonstrate the system with the internet unplugged and, if possible, with the power off, so you know exactly what continues.
Utility rebates for ENERGY STAR smart thermostats are common in all regions and typically run $25 to $100, sometimes bundled with free installation during demand-response enrollment. Insurance discounts for leak sensors and monitored security are national programs with state exclusions; Nationwide, for example, lists five states where its smart home program is unavailable. Check both before ordering equipment.
Submit a request through the contact page with your location and scope; matching is by service area. Then verify each respondent independently: license status for electrical work, insurance certificate, platform authorizations if a dealer system is proposed, and references from projects of similar scope. The reviews page lists what to look for.
 Service guideWhole-Home Automation
Whole-home automation connects lighting, climate, locks, cameras, shades and audio under one interface with scenes and schedules.
 Service guideSmart Lighting Control
Smart lighting control replaces switches and dimmers, or adds keypads and schedules, so rooms respond to scenes, timers and occupancy while the wall switch keeps working.
 Service guideHome Security & Surveillance
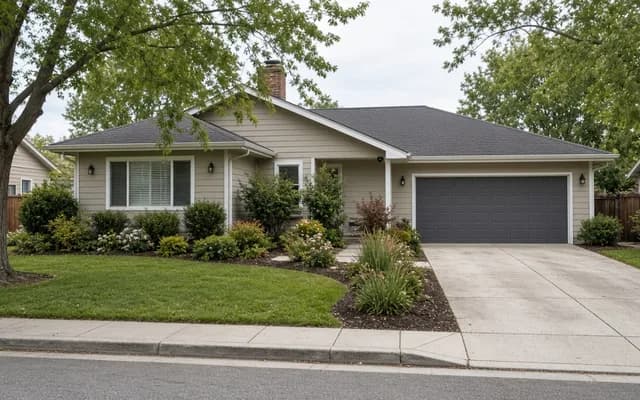
Home security and surveillance covers cameras, door and window sensors, motion detection, video doorbells and smart locks, with or without a monitoring service.
 Service guideHome Theater & Audio
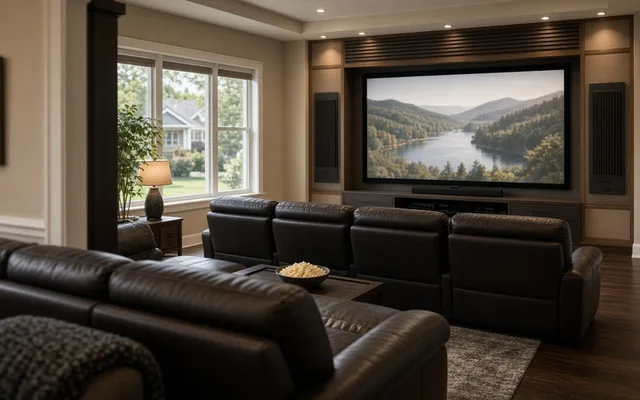
Home theater and audio installation covers dedicated theaters, living-room media setups and multi-room audio, including speakers, displays, receivers, cabling, equipment placement and the controls the household uses daily.
Tell us the size, the condition of what is there now, and what you want to change. Home Control Notes passes your request to independent local professionals, who reply with written, no-obligation estimates. The service is free to use.