Which approach are you leaning toward for your smart home?
Deloitte found fewer than a third of consumers have committed to a single ecosystem.
No votes yet. Yours will be the first. · saved on this device
Loading...

Home Control Notes · Statistics
118 sourced data points on smart home automation: what projects cost, what they return at resale, what homeowners choose, how many U.S. homes already have each feature by region, and 1 finding from Home Control Notes's own analysis of federal household data. Every number links to where it came from.
These comparisons were calculated by Home Control Notes from the Energy Information Administration's 2024 household survey microdata and the Census Bureau's new-housing tables. They answer questions the published reports don't break out.
Home Control Notes analysis · 2024
95% interval 29.9%–34.4% · about 6.2 million homes · 2,593 survey households
95% interval 23.3%–27.3% · about 3.8 million homes · 1,909 survey households
Difference: 6.8 percentage points (95% interval 3.9 to 9.8).
Voice control of lights is more common in higher-income smart-speaker homes. Plan switches and scenes that work without the speaker too, so the lights don't depend on one device.
Source: Home Control Notes analysis of 2024 federal household survey data from the U.S. Energy Information Administration. How we calculated it
45% of U.S. internet households own at least one core smart home device (2025)
Parks Associates counts thermostats, cameras, locks and doorbells as core devices, excluding smart speakers and displays. Nearly half of connected homes already have a foothold, so integrating existing gear is the normal starting point for a whole-home project.
Parks Associates press release (PR Newswire) (2025)20% of U.S. internet households own a video doorbell (2025)
One in five connected households has a video doorbell, making it the most common entry point into home security automation. Installers regularly find the existing transformer too weak to power one.
Parks Associates press release (PR Newswire) (2025)23% of U.S. internet households own a smart appliance, up from 15% in 2020
Smart appliance ownership grew eight points in five years according to Parks Associates. Kitchen and laundry appliances are increasingly candidates for inclusion in a whole-home plan, usually at replacement time.
Parks Associates press release (PR Newswire) (2025)17 devices connected devices in the average U.S. internet household (2025)
Parks Associates says the count has roughly doubled since 2014. Network capacity and wired backhaul are prerequisites for any whole-home design, because client count rather than internet speed is the usual bottleneck.
Parks Associates, The Smart Home in 2025: Outlook and Opportunities18% of U.S. internet households have six or more smart home devices (2024)
Parks Associates' Smart Home Dashboard, based on surveys of 8,000 to 10,000 internet households, shows an enthusiast tier with six-plus devices while mainstream households with one to five now outnumber them. Whole-home systems target the growing mainstream tier.
Parks Associates via SDM Magazine (2024)~7 devices smart home devices owned by the typical adopter (2023)
Deloitte's 2023 connectivity survey found the typical adopter has about seven smart home devices, and no single category had passed 30% of households. A whole-home system consolidates those endpoints into one interface.
Deloitte Insights, Connectivity and Mobile Trends 202373.2% of occupied U.S. primary residences report broadband internet access (2024)
The EIA's 2024 Residential Energy Consumption Survey preliminary microdata counts 97.0 million housing units with broadband. Installed access is not a measure of network capacity, which is the usual smart home bottleneck.
EIA 2024 RECS preliminary household microdata (May 2026)25.0% of occupied U.S. primary residences have a home theater or audio system (2024)
The EIA's 2024 survey counts 33.1 million housing units with a theater or audio system. This is installed stock, not annual purchases, and most are receiver-and-speaker setups rather than dedicated rooms.
EIA 2024 RECS preliminary household microdata (May 2026)35.6% of occupied U.S. primary residences have at least one smart speaker (2024)
The EIA's 2024 survey counts 47.1 million housing units with a smart speaker. Regional figures run from 34.6% in the Midwest to 37.0% in the Northeast. Installed stock, not annual purchases.
EIA 2024 RECS preliminary household microdata (May 2026)18.5% of occupied U.S. primary residences have two or more smart speakers (2024)
The EIA's 2024 survey counts 24.5 million housing units with multiple smart speakers, which usually means voice control in more than one room and an existing ecosystem to build around.
EIA 2024 RECS preliminary household microdata (May 2026)8.4% of occupied U.S. primary residences use a smart speaker for TV or peripheral control (2024)
The EIA's 2024 survey counts 11.2 million housing units. Voice is a convenience layer for media; a physical control that anyone can use remains the plan for a theater or audio system.
EIA 2024 RECS preliminary household microdata (May 2026)52% of DIY smart home users report setup or connectivity problems (2025)
More than half of self-installers hit setup or connectivity trouble, according to Parks Associates. Most of those failures are network and wiring problems, which is the practical argument for professional design of multi-device systems.
Parks Associates press release (PR Newswire) (2025)3% of U.S. internet households buy a smart appliance in a given year (2025)
The annual purchase rate is low despite rising ownership, so most homeowners add smart appliances when an old one fails rather than as a standalone upgrade. Plan integration around replacement cycles.
Parks Associates press release (PR Newswire) (2025)25% vs 3% smart lock ownership in homes with a security system vs without (2026)
Smart locks cluster with monitored security, according to Parks Associates. Homeowners who bundle access control with a security installation are far more likely to adopt it than those buying a lock on its own.
Parks Associates press release (2026)>50% of households planning a move within six months intend to buy a smart lock (2026)
A move is the strongest trigger for buying access-control devices, per Parks Associates. It is also the moment to rekey, check the doorbell transformer and plan camera runs before furniture arrives.
Parks Associates press release (2026)29% of consumers plan to increase spending on connected devices (2025)
Deloitte reports 29% planning to spend more, up from about 9% in 2023, versus 24% planning to cut back. Demand for home technology upgrades is rising again after a lull.
Deloitte 2025 Connected Consumer Survey77% of smart home adopters say the devices improve their quality of life (2023)
Deloitte found strong satisfaction among owners, with 20% reporting frustration or added complexity. Security devices were the category at least two-thirds of owners called essential.
Deloitte Insights, Connectivity and Mobile Trends 202379% of consumers say device interoperability is very or somewhat important (2023)
Yet only 31% had committed to a single ecosystem and 45% still controlled devices through separate apps, per Deloitte. Choosing a unified platform, or Matter-compatible gear, is the main design decision in a whole-home project.
Deloitte Insights, Connectivity and Mobile Trends 202310.3% of occupied U.S. primary residences use a smart speaker to control lighting (2024)
Lighting is the most common voice-controlled function in the EIA's 2024 survey, at 13.7 million housing units. Regional figures are tightly grouped, from 10.1% in the Northeast and South to 10.7% in the West.
EIA 2024 RECS preliminary household microdata (May 2026)54% of surveyed Houzz homeowners renovated in 2025; 50% plan to in 2026
The 2026 U.S. Houzz & Home Study is a platform sample, not all U.S. households, and intent is not completed work. Renovations are the moment when audio cabling and network drops cost least.
2026 U.S. Houzz & Home Study71% of surveyed homeowners who hired a pro prioritized preventative maintenance
Prioritized preventative maintenance: 71% of surveyed homeowners who hired a pro in the previous year (fielded April 15-16, 2025). Source: Angi 2025 Home Spending Pulse.
Angi 2025 Home Spending Pulse6.8 pts Voice lighting-control gap among smart-speaker owners by income (2024)
Home Control Notes's weighted analysis of the EIA's 2024 household survey microdata: smart-speaker owner households with income of $100,000 or more use voice lighting control at 32.1%, versus 25.3% for smart-speaker owner households with income below $100,000 (a 6.8-point gap). Device ownership and actual use of an automation feature are different adoption stages.
Home Control Notes analysis of EIA 2024 RECS household data1.2% Homes using smart speakers to control another device (2024)
1.2% of occupied primary-residence housing units in 2024 (about 1.6M housing units); by region: South 1.3%, West 1.2%. Home Control Notes's weighted analysis of EIA 2024 RECS preliminary household microdata (May 2026).
Home Control Notes analysis of EIA 2024 RECS preliminary household microdata (May 2026)52% of surveyed Houzz homeowners decorated in 2025
Decorated in 2025: 52% of surveyed homeowners on Houzz (2025 activity; 2026 plans). Source: 2026 U.S. Houzz & Home Study.
2026 U.S. Houzz & Home Study47% of surveyed Houzz homeowners made repairs in 2025
Repaired in 2025: 47% of surveyed homeowners on Houzz (2025 activity; 2026 plans). Source: 2026 U.S. Houzz & Home Study.
2026 U.S. Houzz & Home Study50% of surveyed Houzz homeowners plan a renovation in 2026
Plan renovation in 2026: 50% of surveyed homeowners on Houzz (2025 activity; 2026 plans). Source: 2026 U.S. Houzz & Home Study.
2026 U.S. Houzz & Home Study29% of surveyed homeowners who hired a pro bundled repairs (2025)
Bundled repairs: 29% of surveyed homeowners who hired a pro in the previous year (fielded April 15-16, 2025). Source: Angi 2025 Home Spending Pulse.
Angi 2025 Home Spending Pulse19% of surveyed homeowners who hired a pro chose cheaper materials or services
Selected cheaper materials/services: 19% of surveyed homeowners who hired a pro in the previous year (fielded April 15-16, 2025). Source: Angi 2025 Home Spending Pulse.
Angi 2025 Home Spending Pulse23% of surveyed homeowners who hired a pro started early to beat price rises
Started early before price rises: 23% of surveyed homeowners who hired a pro in the previous year (fielded April 15-16, 2025). Source: Angi 2025 Home Spending Pulse.
Angi 2025 Home Spending Pulse62% of surveyed homeowners who hired a pro grew more worried about upkeep costs
Increased maintenance-affordability concern: 62% of surveyed homeowners who hired a pro in the previous year (fielded April 15-16, 2025). Source: Angi 2025 Home Spending Pulse.
Angi 2025 Home Spending Pulse11% of U.S. internet households have a smart lock; 11% a smart garage opener (2026)
Access control remains early-stage compared with cameras and doorbells, per Parks Associates' March 2026 release. Most homes planning automation will be adding a lock for the first time, so code management and key override deserve attention.
Parks Associates press release (2026)70% of consumers worry about the privacy and security of their personal data (2025)
Up from 60% in 2024 in Deloitte's survey. Homeowners should expect installers to address network segmentation, camera data handling and account ownership as part of the plan, not as an afterthought.
Deloitte 2025 Connected Consumer Survey~50% of U.S. households use security cameras; one in three has a full system (2025)
SafeWise's State of Safety survey of 5,000 adults shows camera use continuing to climb, with a third of households relying on a complete security system.
SafeWise State of Safety (2025)$896 average household spending on connected devices in 2025, up from $764
Deloitte's 2025 Connected Consumer Survey of 3,524 U.S. consumers shows annual device spending up 17% year over year. Budgets for connected technology are growing, which argues for spending on infrastructure that outlasts a product cycle.
Deloitte 2025 Connected Consumer Survey$771 average cost of a consumer smart home system, range $201–$1,519 (Angi, 2026)
Angi's cost guide, updated March 2026, covers a basic connected setup such as a hub, thermostat, lighting and doorbell. Bespoke whole-home integration, new wiring, theater equipment and recurring support are different projects.
Angi, How Much Does a Smart Home System Cost (2026)$2,000–$15,000+ HomeGuide smart home tiers: select rooms, whole-home, fully custom (2026)
HomeGuide's tiers reflect how far integration extends: $2,000–$5,000 for select rooms, $5,000–$15,000 for whole-home integration, and $15,000 and up for fully custom systems.
HomeGuide, How Much Does a Smart Home Cost (2026)$1,000–$5,000 typical cost of fully automated whole-home lighting control (prices as of January 2023)
Today's Homeowner's guide puts a complete smart lighting installation in this range, with individual smart bulbs at $15–$70 and smart switches from $15 to $300 or more. The page title carries a newer year, but its price tables are marked as of January 2023.
Today's Homeowner, How Expensive Are Smart Homes (2023)$2,000–$4,000 cost of a fully equipped living room with a home theater system (prices as of January 2023)
Today's Homeowner's cost guide places a living-room entertainment setup among the mid-priced subsystems, alongside security at $500–$5,000 or more and HVAC automation at $1,000–$3,000. Its prices are marked as of January 2023. A dedicated theater room is a separate, much larger project.
Today's Homeowner, How Expensive Are Smart Homes (2023)$80–$100/hr professional smart home installation labor rate (prices as of January 2023)
Today's Homeowner notes rewiring a whole home typically costs $2,000–$4,000 and can reach $10,000 in larger homes, which is why retrofit projects should be scoped room by room and labor listed separately. Its prices are marked as of January 2023; HomeAdvisor's June 2026 camera-installation labor rate of $50–$100 an hour is a newer cross-check.
Today's Homeowner, How Expensive Are Smart Homes (2023)$200–$500 smart thermostat cost professionally installed ($100–$300 device only)
Vivint's 2026 pricing guide also reports the average cost to fix a DIY installation mistake is $188, roughly the price of the professional install itself.
Vivint, How Much Does Home Automation Cost (2026)$30–$60/mo typical cost of professional security monitoring
SoFi's cost guide pegs monitoring at $30–$60 monthly and general smart home subscriptions at $10–$50, recurring costs homeowners should budget alongside hardware.
SoFi, How Much Do Smart Homes Cost (2025)$1,289 average cost to install security cameras, typical range $589–$2,040 (HomeAdvisor, 2026)
HomeAdvisor's June 2026 guide reports basic installations from about $125 and high-end systems above $3,500. Installed cost by type runs $100–$250 for a bullet camera, $100–$270 for a dome, $250–$600 for a floodlight camera and $100–$300 for a doorbell camera.
HomeAdvisor, Security Camera Installation Cost (2026)$80–$200 per camera security camera installation labor, or $50–$100 an hour (HomeAdvisor, 2026)
HomeAdvisor's June 2026 guide says labor makes up 50% to 70% of a camera installation. Wired IP cameras run $100–$500 each installed against $100–$250 for wireless IP cameras, because of the cable runs.
HomeAdvisor, Security Camera Installation Cost (2026)$25,000–$60,000+ cost of a custom dedicated home theater room (AWOL Vision, 2026)
AWOL Vision's May 2026 guide sets a professional media room installation at $10,000–$30,000, a custom dedicated theater at $25,000–$60,000 or more, and a luxury reference-grade cinema room at $60,000–$100,000 or more. AWOL sells projectors, so treat it as a vendor source.
AWOL Vision, Home Theater Installation Cost (2026)$2,092–$3,237 installed cost of a basic 5.1 home theater system (Homewyse, September 2026)
Homewyse prices a discrete 5.1-channel system with a compact speaker set and 100W subwoofer, including locating and cutting openings for one display and one receiver, installing five speakers and running the cabling between components.
Homewyse, Cost to Install Home Theater System (2026)$2.99–$10/mo entry cloud video plans: Wyze $2.99, Ring $4.99, Nest $10 a month (Security.org, 2026)
Security.org's May 2026 camera cost guide also lists Blink and Eufy at $3.99 and Arlo at $9.99 for entry plans, professional monitoring from $9.99 to $100 a month, and first-year camera costs of $200 to $800 for most households.
Security.org, Security Camera Costs (2026)4,200+ Matter-certified devices expected by the end of 2026
The Matter standard backed by Apple, Google, Amazon and Samsung keeps expanding its certified catalog, which reduces lock-in risk when mixing brands. Cameras and audio are not yet fully covered.
Your Matter Home, Matter Devices List 202666.5% of occupied U.S. primary residences have an internet streaming device (2024)
The EIA's 2024 survey counts 88.1 million housing units, from 63.2% in the Northeast to 67.8% in the South. Streaming is what most living-room media systems are built around.
EIA 2024 RECS preliminary household microdata (May 2026)8% / $50 annual heating and cooling savings from an ENERGY STAR smart thermostat
Certified models must demonstrate at least 8% heating and 10% cooling runtime reduction in field data, which ENERGY STAR summarizes as about 8% of heating and cooling bills, roughly $50 a year. Savings are larger in extreme climates.
ENERGY STAR Smart Thermostats FAQ (2025)$900+ annual heating and cooling cost, nearly half the average household energy bill
ENERGY STAR uses this baseline to explain why thermostat automation is the highest-impact energy device in a smart home. An 8% saving on $900 is the arithmetic behind the thermostat payback.
ENERGY STAR Smart Thermostats (2025)6.2% of occupied U.S. primary residences use a smart speaker for temperature control (2024)
The EIA's 2024 survey counts 8.2 million housing units. Voice control of climate lags lighting and security, which suggests most thermostat automation runs on schedules rather than commands.
EIA 2024 RECS preliminary household microdata (May 2026)96% reduction in water-damage insurance claims after smart shutoff installation (2020)
LexisNexis compared 2,306 homes with Flo by Moen shutoff devices against a control group one year before and after installation. Claim severity also fell 72% while the control group's claims rose 10%.
LexisNexis Risk Solutions press release (2020)up to 10% Nationwide discount on fire, theft and water coverage with smart devices
Nationwide provides a free Ting electrical sensor and a free LeakBot leak detector to eligible policyholders; the discount is removed if the device is not activated within 55 days. Not available in AK, HI, LA, NY or OK.
Nationwide Smart Home program (2026)5–13% typical carrier discounts for smart home devices (Allstate 5%, Hippo 10–13%)
SmartFinancial's roundup shows typical discounts for monitored security, leak and fire sensors. Eligible device lists vary by carrier, so confirm model numbers with your insurer before purchase.
SmartFinancial, Smart Home Device Insurance Discounts (2022)+34% growth in for-sale listings mentioning EV chargers, 2024 vs 2023
Zillow's 2025 home trends report shows electrified, tech-forward features climbing in listing descriptions; whole-home batteries rose 62%. Connected infrastructure is becoming a selling point.
Zillow 2025 Home Trends74.7% of occupied primary residences in the Northeast report broadband (2024)
Highest of the four census regions in the EIA's 2024 survey; the Midwest is lowest at 71.6%, the South 72.9% and the West 74.0%. Regional figures are not extrapolated to states or cities.
EIA 2024 RECS preliminary household microdata (May 2026)28.7% of occupied primary residences in the West have a home theater or audio system (2024)
Highest of the four census regions in the EIA's 2024 survey; the Midwest is 26.7%, the South 23.5% and the Northeast 21.6%. Outdoor audio zones are more common in the West.
EIA 2024 RECS preliminary household microdata (May 2026)9.0% of occupied U.S. primary residences use a smart speaker for security, camera or lock control (2024)
The EIA's 2024 survey counts 12.0 million housing units. Regionally the South is highest at 9.7% and the Northeast lowest at 7.5%.
EIA 2024 RECS preliminary household microdata (May 2026)Homes with at least one smart speaker: 37% nationally. Highest in Utah (46.2%), Iowa (45%), Massachusetts (44%); lowest in Vermont (25.6%), Arkansas (26.1%), New Mexico (26.4%).
Homes with a backup generator: 20.3% nationally. Highest in Maine (53.7%), Louisiana (39.9%), New Hampshire (36.1%); lowest in Colorado (9.6%), District of Columbia (9.9%), Arizona (10.9%).
Households with an electric vehicle: 4.5% nationally. Highest in California (12.5%), Hawaii (9.3%), Colorado (8.9%); lowest in Tennessee (3.1%), Texas (3.3%), Illinois (3.4%).
Home Control Notes calculated these state estimates from the Energy Information Administration's 2024 household survey microdata. EIA publishes the 2024 survey nationally and by region, not by state. Shares are weighted; a dash means the state sample was too small for a reliable estimate (fewer than 100 households, fewer than 10 yes answers, or a relative standard error above 30%). Source data.
| State | Homes with at least one smart speaker | Homes with a backup generator | Households with an electric vehicle |
|---|---|---|---|
| United States | 37% | 20.3% | 4.5% |
| Alabama | 31.3% | 24.1% | — |
| Alaska | 32.2% | 31.8% | — |
| Arizona | 37% | 10.9% | 5.1% |
| Arkansas | 26.1% | 21.5% | — |
| California | 37.8% | 11.1% | 12.5% |
| Colorado | 43.2% | 9.6% | 8.9% |
| Connecticut | 37.7% | 33% | 4.7% |
| Delaware | 41.5% | 24.4% | 7.5% |
| District of Columbia | 31.5% | 9.9% | 5.2% |
| Florida | 41.9% | 30% | 5% |
| Georgia | 35.9% | 21% | — |
| Hawaii | 30% | 17.9% | 9.3% |
| Idaho | 30.8% | 20% | — |
| Illinois | 41.7% | 16.6% | 3.4% |
| Indiana | 30.4% | 16.5% | 3.5% |
| Iowa | 45% | 22.7% | — |
| Kansas | 35.5% | 13.3% | — |
| Kentucky | 38.3% | 22.6% | — |
| Louisiana | 27.7% | 39.9% | — |
| Maine | 28.3% | 53.7% | — |
| Maryland | 41% | 19.9% | 8% |
| Massachusetts | 44% | 17.7% | 6.3% |
| Michigan | 35.7% | 34.2% | — |
| Minnesota | 34.3% | 19.3% | — |
| Mississippi | 27% | 28.8% | — |
| Missouri | 30.5% | 18.4% | — |
| Montana | 30.8% | 19.1% | — |
| Nebraska | 43.7% | 15.2% | — |
| Nevada | 36.8% | 11.3% | 4.7% |
| New Hampshire | 36.2% | 36.1% | — |
| New Jersey | 41.1% | 19.4% | 5.2% |
| New Mexico | 26.4% | 11.2% | — |
| New York | 38.9% | 17.3% | 3.7% |
| North Carolina | 34.9% | 25.9% | — |
| North Dakota | 34.4% | 20.7% | — |
| Ohio | 34.7% | 20.1% | — |
| Oklahoma | 30% | 26.8% | — |
| Oregon | 27.9% | 18.8% | 7.7% |
| Pennsylvania | 36% | 20.8% | — |
| Rhode Island | 33% | 28.2% | — |
| South Carolina | 43.4% | 25% | — |
| South Dakota | 31.2% | 22.8% | — |
| Tennessee | 34.8% | 19% | 3.1% |
| Texas | 37.6% | 19.3% | 3.3% |
| Utah | 46.2% | 16.3% | — |
| Vermont | 25.6% | 19.5% | 7.1% |
| Virginia | 32.6% | 19.9% | 4.4% |
| Washington | 42.6% | 19.5% | 8.6% |
| West Virginia | 29.4% | 31.8% | — |
| Wisconsin | 36.7% | 15.2% | — |
| Wyoming | 29.4% | 25.3% | — |
How many existing homes already have the features that shape a smart home automation project, nationally and in each census region. Home Control Notes weighted these from the federal survey records; counts are rounded.
| Measure | U.S. | Northeast | Midwest | South | West | Source |
|---|---|---|---|---|---|---|
| Homes with at least one smart speaker2024 · occupied primary-residence housing units | 35.6% | 37.0% | 34.6% | 35.1% | 36.2% | U.S. Energy Information Administration |
| Homes with at least two smart speakers2024 · occupied primary-residence housing units | 18.5% | 18.9% | 18.2% | 18.3% | 18.7% | U.S. Energy Information Administration |
| Homes using smart speakers for lighting control2024 · occupied primary-residence housing units | 10.3% | 10.1% | 10.5% | 10.1% | 10.7% | U.S. Energy Information Administration |
| Homes using smart speakers for temperature control2024 · occupied primary-residence housing units | 6.2% | 5.4% | 6.8% | 5.9% | 6.8% | U.S. Energy Information Administration |
| Homes using smart speakers for security, camera or lock control2024 · occupied primary-residence housing units | 9.0% | 7.5% | 9.1% | 9.7% | 8.9% | U.S. Energy Information Administration |
| Homes using smart speakers for TV or peripheral control2024 · occupied primary-residence housing units | 8.4% | 7.9% | 8.7% | 8.3% | 8.7% | U.S. Energy Information Administration |
| Homes using smart speakers to control another device2024 · occupied primary-residence housing units | 1.2% | — | — | 1.3% | 1.2% | U.S. Energy Information Administration |
| Homes reporting broadband internet access2024 · occupied primary-residence housing units | 73.2% | 74.7% | 71.6% | 72.9% | 74.0% | U.S. Energy Information Administration |
| Homes with a home theater or audio system2024 · occupied primary-residence housing units | 25.0% | 21.6% | 26.7% | 23.5% | 28.7% | U.S. Energy Information Administration |
| Homes with an internet streaming device2024 · occupied primary-residence housing units | 66.5% | 63.2% | 67.5% | 67.8% | 65.7% | U.S. Energy Information Administration |
Published figures come from Parks Associates press release, Parks Associates, Parks Associates via SDM Magazine, Deloitte 2025 Connected Consumer Survey, Deloitte Insights, Your Matter Home, ENERGY STAR Smart Thermostats FAQ, ENERGY STAR Smart Thermostats and other named sources, each linked where it appears. Housing data by region is Home Control Notes's weighted tabulation of the EIA's 2024 Residential Energy Consumption Survey public microdata, using the survey's own weights and 60 replicate weights for the intervals, and of the Census Bureau's Characteristics of New Housing tables. Figures describe the period and population shown next to each one.
Homeowner polls
Deloitte found fewer than a third of consumers have committed to a single ecosystem.
No votes yet. Yours will be the first. · saved on this device
No votes yet. Yours will be the first. · saved on this device
No votes yet. Yours will be the first. · saved on this device
35.6% nationally in 2024 (about 47.1M housing units), based on Home Control Notes' weighted analysis of EIA 2024 RECS preliminary household microdata (May 2026). The share is highest in the Northeast at 37.0% and lowest in the Midwest at 34.6%. The figure covers occupied primary-residence housing units.
18.5% nationally in 2024 (about 24.5M housing units), based on Home Control Notes' weighted analysis of EIA 2024 RECS preliminary household microdata (May 2026). The share is highest in the Northeast at 18.9% and lowest in the Midwest at 18.2%. The figure covers occupied primary-residence housing units.
10.3% nationally in 2024 (about 13.7M housing units), based on Home Control Notes' weighted analysis of EIA 2024 RECS preliminary household microdata (May 2026). The share is highest in the West at 10.7% and lowest in the Northeast at 10.1%. The figure covers occupied primary-residence housing units.
6.2% nationally in 2024 (about 8.2M housing units), based on Home Control Notes' weighted analysis of EIA 2024 RECS preliminary household microdata (May 2026). The share is highest in the Midwest at 6.8% and lowest in the Northeast at 5.4%. The figure covers occupied primary-residence housing units.
9.0% nationally in 2024 (about 12.0M housing units), based on Home Control Notes' weighted analysis of EIA 2024 RECS preliminary household microdata (May 2026). The share is highest in the South at 9.7% and lowest in the Northeast at 7.5%. The figure covers occupied primary-residence housing units.
Voice control of lights is more common in higher-income smart-speaker homes. Plan switches and scenes that work without the speaker too, so the lights don't depend on one device. Home Control Notes calculated this from the federal government's 2024 household survey data: smart-speaker owner households with income of $100,000 or more 32.1% versus smart-speaker owner households with income below $100,000 25.3%.
$896. Deloitte's 2025 Connected Consumer Survey of 3,524 U.S. consumers shows annual device spending up 17% year over year. Budgets for connected technology are growing, which argues for spending on infrastructure that outlasts a product cycle. Source: Deloitte 2025 Connected Consumer Survey.
8% / $50. Certified models must demonstrate at least 8% heating and 10% cooling runtime reduction in field data, which ENERGY STAR summarizes as about 8% of heating and cooling bills, roughly $50 a year. Savings are larger in extreme climates. Source: ENERGY STAR Smart Thermostats FAQ (2025).
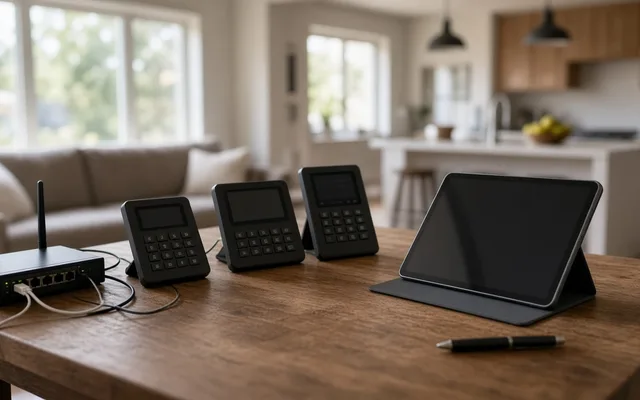 Free toolSmart home cost calculator: size a budget by control points
Size, material tier and complexity in, a realistic budget range out.
 Free toolSmart home comparisons: the five decisions that shape the project
Side-by-side tables for the decisions that change the price most.
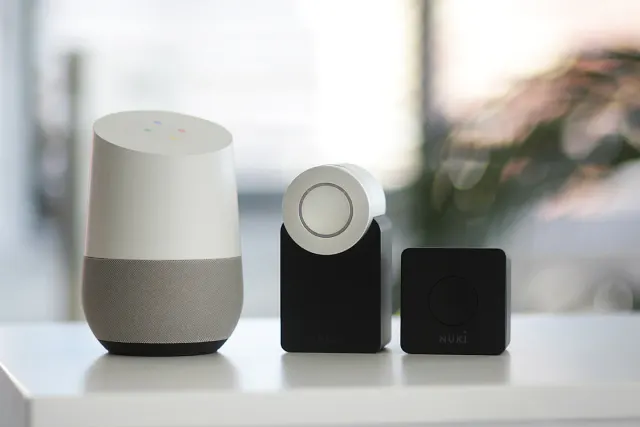 Free toolSmart home readiness quiz: do you know the details installers will ask about?
10 questions that show what you already know and what to check next.
 Free toolSmart home polls: how other homeowners weighed the same decisions
See what other planners chose and add your vote.
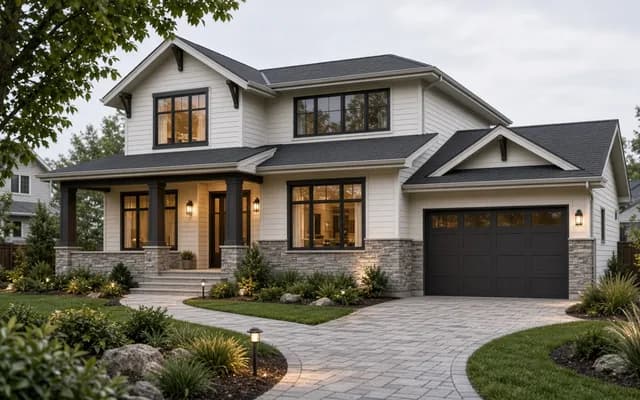 Service guideWhole-Home Automation
Whole-home automation connects lighting, climate, locks, cameras, shades and audio under one interface with scenes and schedules.
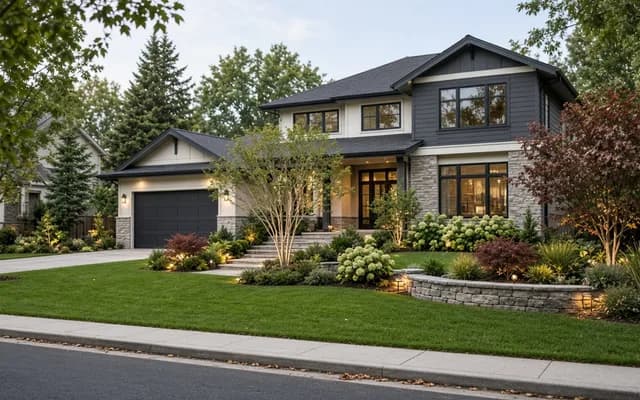 Service guideSmart Lighting Control
Smart lighting control replaces switches and dimmers, or adds keypads and schedules, so rooms respond to scenes, timers and occupancy while the wall switch keeps working.
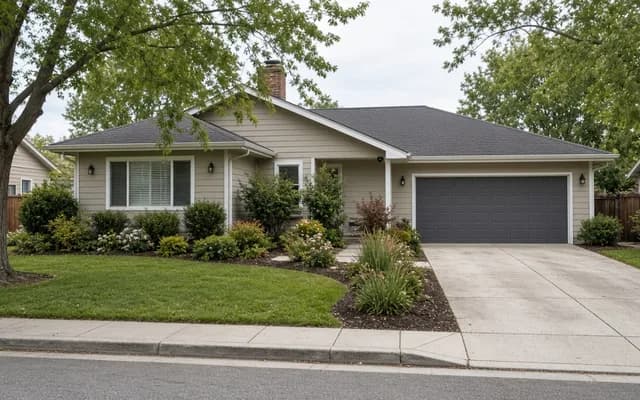 Service guideHome Security & Surveillance
Home security and surveillance covers cameras, door and window sensors, motion detection, video doorbells and smart locks, with or without a monitoring service.
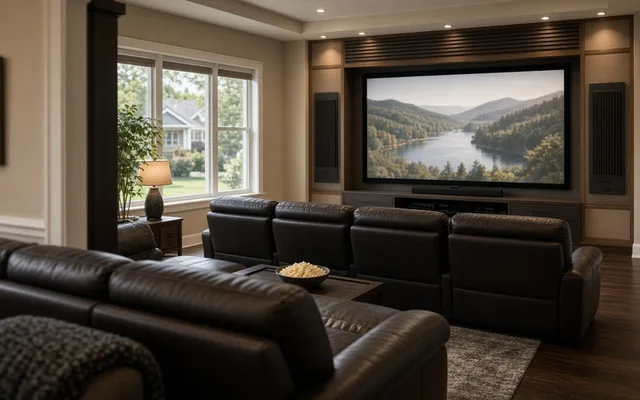 Service guideHome Theater & Audio
Home theater and audio installation covers dedicated theaters, living-room media setups and multi-room audio, including speakers, displays, receivers, cabling, equipment placement and the controls the household uses daily.
Tell us the size, the condition of what is there now, and what you want to change. Home Control Notes passes your request to independent local professionals, who reply with written, no-obligation estimates. The service is free to use.