Which approach are you leaning toward for your smart home?
Deloitte found fewer than a third of consumers have committed to a single ecosystem.
No votes yet. Yours will be the first. · saved on this device
Loading...
Home Control Notes · Polls
These polls collect homeowner opinion on the decisions that shape a smart home project: platform, first routine, outage priorities, lighting control type, camera storage, monitoring, privacy concerns, theater plans, budget, subscriptions and account ownership.
Go to the pollsEvery poll below is answered by visitors planning smart home automation. Results update the moment you vote, one vote per poll per browser, and your own choices stay highlighted so you can compare them with everyone else's. Nothing here is a sales survey; use it to see which trade-offs other homeowners are weighing before you request estimates.
14 polls · newly opened, so every vote shapes the first results · results saved on this device. Vote on any poll you have not answered; your own votes are highlighted.
Deloitte found fewer than a third of consumers have committed to a single ecosystem.
No votes yet. Yours will be the first. · saved on this device
No votes yet. Yours will be the first. · saved on this device
Parks Associates puts the average U.S. internet household at about 17.
No votes yet. Yours will be the first. · saved on this device
No votes yet. Yours will be the first. · saved on this device
No votes yet. Yours will be the first. · saved on this device
No votes yet. Yours will be the first. · saved on this device
No votes yet. Yours will be the first. · saved on this device
SoFi's 2025 guide puts professional monitoring at $30 to $60 a month.
No votes yet. Yours will be the first. · saved on this device
No votes yet. Yours will be the first. · saved on this device
No votes yet. Yours will be the first. · saved on this device
No votes yet. Yours will be the first. · saved on this device
Angi's 2026 consumer benchmark averages $771; HomeGuide's whole-home tier is $5,000 to $15,000.
No votes yet. Yours will be the first. · saved on this device
No votes yet. Yours will be the first. · saved on this device
No votes yet. Yours will be the first. · saved on this device
By the numbers
Poll results above are from visitors to this site; these figures come from published research.
35.6%
of occupied U.S. primary residences have at least one smart speaker (2024)
The EIA's 2024 survey counts 47.1 million housing units with a smart speaker. Regional figures run from 34.6% in the Midwest to 37.0% in the Northeast. Installed stock, not annual purchases.
EIA 2024 RECS preliminary household microdata (May 2026) (2024)45%
of U.S. internet households own at least one core smart home device (2025)
Parks Associates counts thermostats, cameras, locks and doorbells as core devices, excluding smart speakers and displays. Nearly half of connected homes already have a foothold, so integrating existing gear is the normal starting point for a whole-home project.
Parks Associates press release (PR Newswire) (2025)29%
of consumers plan to increase spending on connected devices (2025)
Deloitte reports 29% planning to spend more, up from about 9% in 2023, versus 24% planning to cut back. Demand for home technology upgrades is rising again after a lull.
Deloitte 2025 Connected Consumer Survey (2025)10.3%
of occupied U.S. primary residences use a smart speaker to control lighting (2024)
Lighting is the most common voice-controlled function in the EIA's 2024 survey, at 13.7 million housing units. Regional figures are tightly grouped, from 10.1% in the Northeast and South to 10.7% in the West.
EIA 2024 RECS preliminary household microdata (May 2026) (2024)Sourced statistics tell you what U.S. households own; polls tell you what people planning a project are worried about. Our analysis of the EIA's 2024 survey found a smart speaker in 35.6% of homes and lighting as its most common control use, at 10.3%, but it cannot say whether the household planning a system this month cares more about outage behavior or monthly fees. That is what the polls here ask.
Vote, then compare your answer with the running results. The polls are grouped into five categories, starting with platform and control, the site's core theme, followed by lighting, security, theater and audio, and budget. Take them alongside the quiz and the comparisons, and bring your answers to the contact page.
As opinion, not evidence. Respondents are visitors who chose to answer, which skews toward people actively planning a project and toward those who read this far. Results are useful for seeing which concerns are common and for phrasing your own priorities. They are not useful for predicting what will work in your house, which depends on wiring, network and household habits that no poll can see.
Where a poll touches a measured figure, the service pages give the measured version. Parks Associates found 45% of internet households own a core smart device; a poll asking how many devices visitors have is a different, smaller population. Keep the two apart when you quote either.
Each poll maps to a decision an installer will ask about or should. Platform choice and outage priority shape the whole-home specification. Lighting control type and room count size a lighting estimate. Camera storage, monitoring and privacy concern size a security estimate and its recurring fees. Theater room type and audio zones size an audio estimate. Budget, subscription tolerance and account ownership decide whether a proposal fits the household at all.
Options are written to be neutral and mutually exclusive, so a result reads cleanly. Where a poll has an 'undecided' option, choosing it is a legitimate answer and a signal to read the relevant service page before requesting estimates.
Your own answers make a good opening for a request: the platform you lean toward, the function that must survive an outage, the storage and monitoring approach, the subscription ceiling, and the budget range from the calculator. Installers can price that, and ownership is broad: Parks Associates found 45% of U.S. internet households own at least one core smart home device. Deloitte found 29% of consumers plan to increase spending on connected devices, and the ones who spend well are the ones who arrive with decisions made.
Expect gaps. Visitors planning a system tend to report more devices, higher budgets and stronger outage concerns than the EIA's cross-section of all households, because they are further along. When a poll result surprises you, check the matching statistic: SafeWise's finding that ~50% of households use cameras and one in three runs a full system is the national picture, while a poll here on monitoring preference reflects people about to buy one. Both are true of different groups, and the difference is informative rather than a contradiction.
No. For representative figures, use the sourced statistics on the service pages, which come from the EIA, Parks Associates, Deloitte and SafeWise with stated samples and denominators. Polls and statistics answer different questions and should not be mixed.
Each poll accepts one vote per visitor, tracked in the browser. Clearing browser data allows another vote, so results are approximate by nature. That is one more reason to treat them as a snapshot of opinion rather than a measurement.
Because open-ended options make results unreadable. Each poll's options were chosen to cover the realistic choices with an 'undecided' or 'none' option where appropriate. If your situation does not fit, the comparison and service pages are written to handle the nuance a poll cannot.
Only as any visitor does. Results are not sent with requests and are not tied to your identity. If you want an installer to know your priorities, put them in the request itself; that is where they are useful.
They follow the site's four service scopes plus budget, with platform and control first because it is the decision every other one depends on. Each category has two to four polls, enough to cover the main decisions without turning the page into a survey.
When a new decision becomes common enough to ask about, such as battery backup priorities in regions with power shutoffs, or Matter adoption once cameras join the standard. Existing polls stay open so results accumulate rather than resetting.
Read the whole-home service page, which explains the platform, network and account decisions everything else depends on, then take the quiz. Undecided is an honest starting point, and it is better to arrive at an estimate with a few settled priorities than with a device list and no plan.
 Free toolSmart home cost calculator: size a budget by control points
Size, material tier and complexity in, a realistic budget range out.
 Free toolSmart home comparisons: the five decisions that shape the project
Side-by-side tables for the decisions that change the price most.
 Free toolSmart home readiness quiz: do you know the details installers will ask about?
10 questions that show what you already know and what to check next.
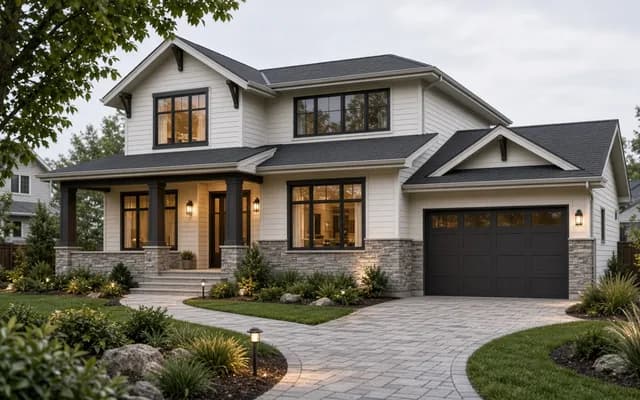 Service guideWhole-Home Automation
Whole-home automation connects lighting, climate, locks, cameras, shades and audio under one interface with scenes and schedules.
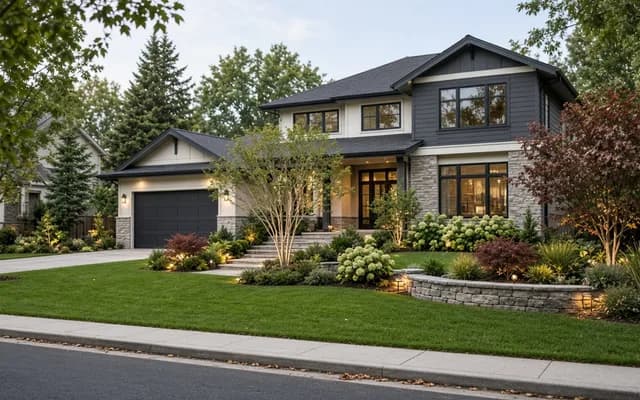 Service guideSmart Lighting Control
Smart lighting control replaces switches and dimmers, or adds keypads and schedules, so rooms respond to scenes, timers and occupancy while the wall switch keeps working.
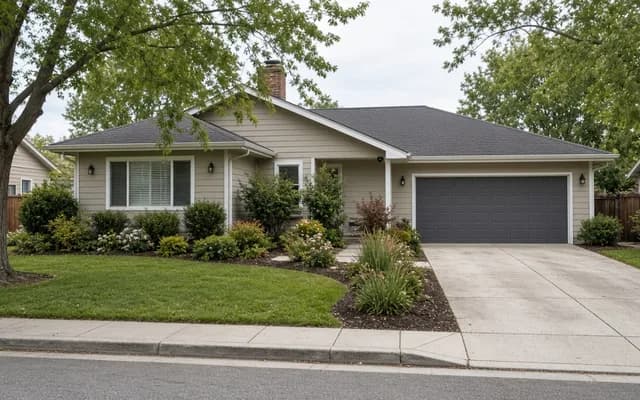 Service guideHome Security & Surveillance
Home security and surveillance covers cameras, door and window sensors, motion detection, video doorbells and smart locks, with or without a monitoring service.
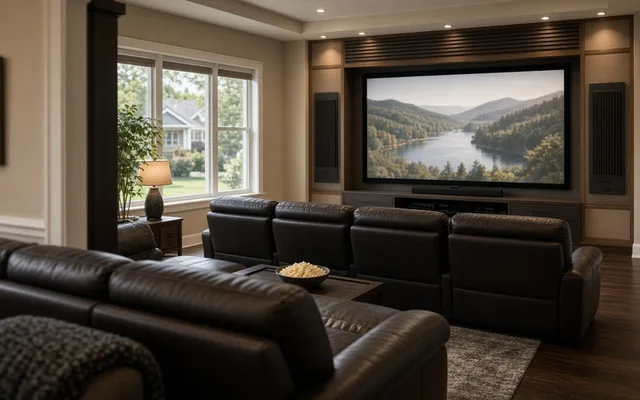 Service guideHome Theater & Audio
Home theater and audio installation covers dedicated theaters, living-room media setups and multi-room audio, including speakers, displays, receivers, cabling, equipment placement and the controls the household uses daily.
Tell us the size, the condition of what is there now, and what you want to change. Home Control Notes passes your request to independent local professionals, who reply with written, no-obligation estimates. The service is free to use.